OPUS software package: process and reaction

CMET process software
CMET process software
Stable and reliable software solutions are indispensable in quality control applications, especially in process quality control.Brooke - CMET, independent research and development of process control software can run independently of the OPUS and do quality control evaluation, and OPUS and spectrometer communications in the background.At the time of unattended, if there are any sudden incident, CMET software can run to reset itself, to ensure the production the continuous and stable operation.
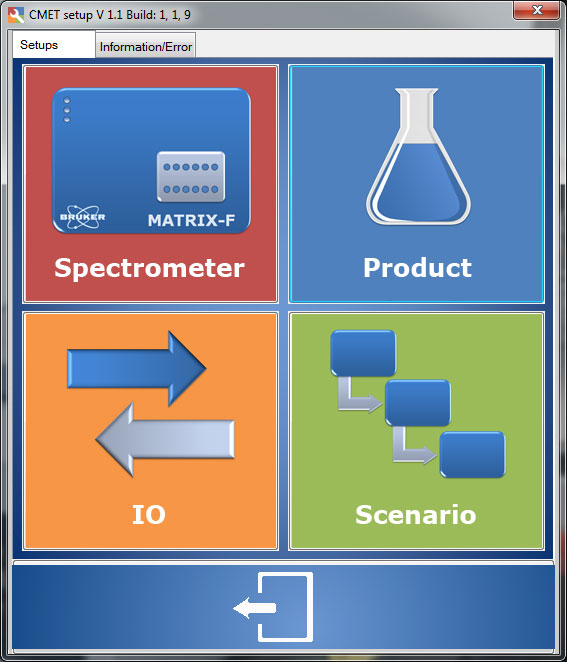
CMET including process set up and the process runs.Settings interface is modular and flexible interface, and integrate all the necessary functions, can be set up for any of the batch and continuous production process control process.This includes spectrometer set up, product set, communication protocols define input and output, and process control plan Settings.
In process control process Settings, all Settings can be combined with each other, you can add specific spectrometer, can be set for a particular measurement channel to develop products.If necessary can define external trigger function, the implementation of specific measurement strategy.
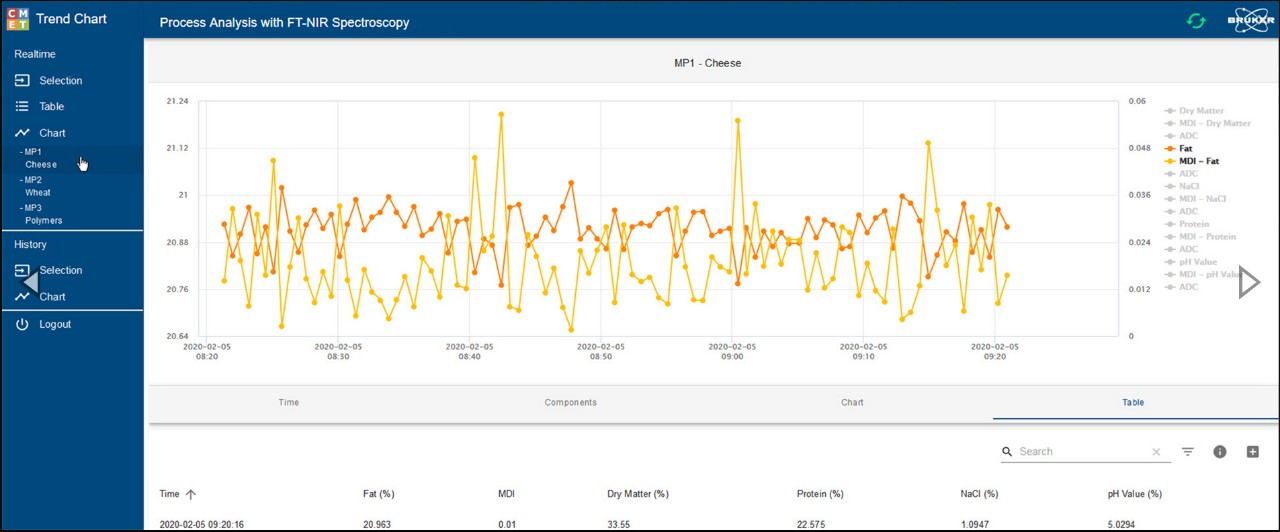
Process control process set up is completed, can perform the operation.The software provides a complete overview of scenarios, including the currently running task and the trend of the monitoring data of all specified products.Trend graph visualization is done through the browser, the browser can view and analysis of test results of all products.
CMET software provides the most commonly used industry standard interface, can make its embedded into any process control environment, support a variety of standard communication protocol, including:
- 4-20 mA
- Modbus
- Profibus DP
- OPC
OPUS software package: CMET process software
CMET scheme definition
CMET trends show
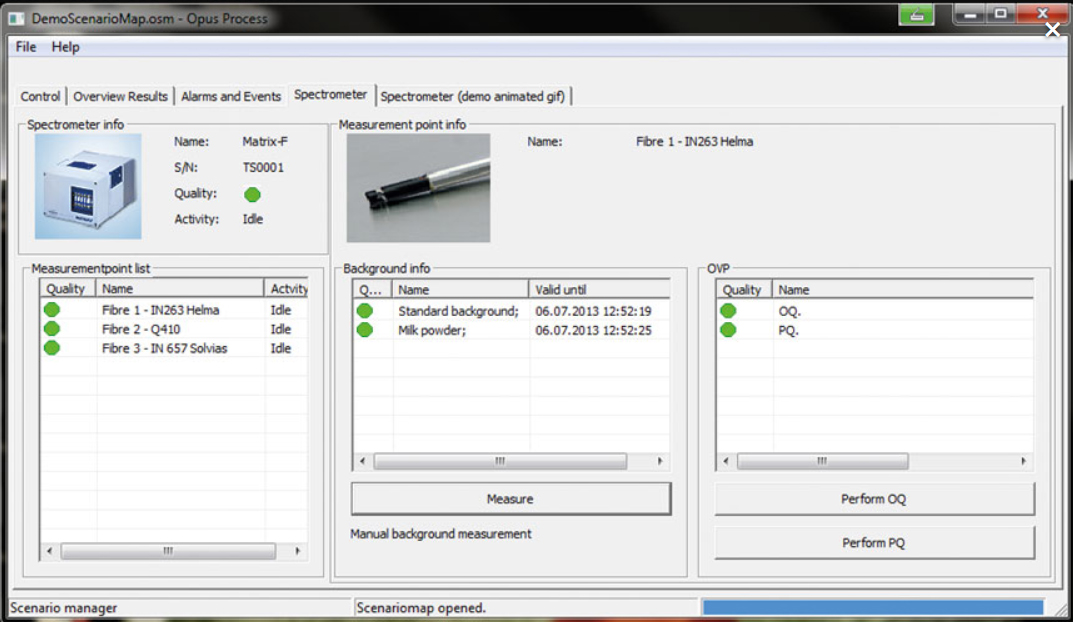
CMET Settings screen
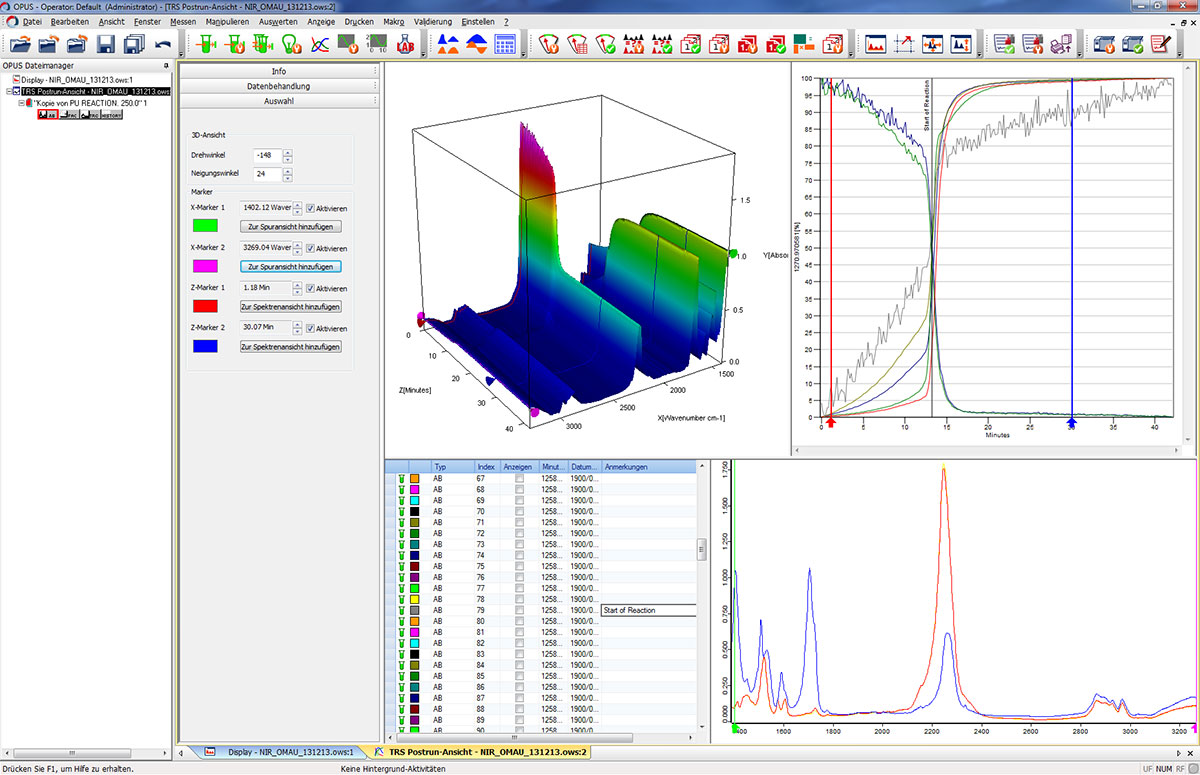
Reaction monitoring
Reaction monitoring
In the industrial environment (e.g., pilot plant), real-time measurement and data visualization and chemical reaction process evaluation is very important.For this, brooke launched special package, used to provide a reaction monitoring required functions.
- Set the continuous measurement in monitoring and analysis of the chemical reaction
- 2 d and 3 d spectrogram, the visual and intelligent visualization options with real-time display
- Spectrum real-time assessment, by using multivariate methods
- Interactive integration method, can be set in monitoring before and during the process of reaction
- PCA (principal component analysis (PCA) can easily implement trends and data analysis
- Event viewer includes spectrum information, data, information extraction method and the reaction in the process of annotated
- Classic multivariate data analysis tool combination in a software package, the tool includes a variety of ways to used for data preprocessing
- Event viewer includes spectrum information, data, information extraction method and the reaction in the process of annotated
- The reaction end point determination of different patterns(manually or automatically), including monitoring after the reaction sequence method
- The finish automatic detection, or integral result is based on the PCA method
OPUS software package: reaction monitoring
OPUS reaction monitoring